Managing Partner and CIO of Renaissance Investment Management
Inflation data through October, released on November 10, showed an inflation rate below most expectations. If inflation has truly peaked and a serious recession is avoided, the historical evidence suggests that stocks are likely to do well going forward.
The Consumer Price Index (CPI) posted a 0.4% rise on a month-to-month basis and a 7.7% change on a year-over-year basis, with the latter being the lowest annual rate reported since January. The core inflation rate (excluding food and energy components) was also below expectations, rising 0.3% on a month-to-month basis and 6.3% on an annual basis.
Rolling 12-Month Change in CPI, 1/1/1946–11/1/2022
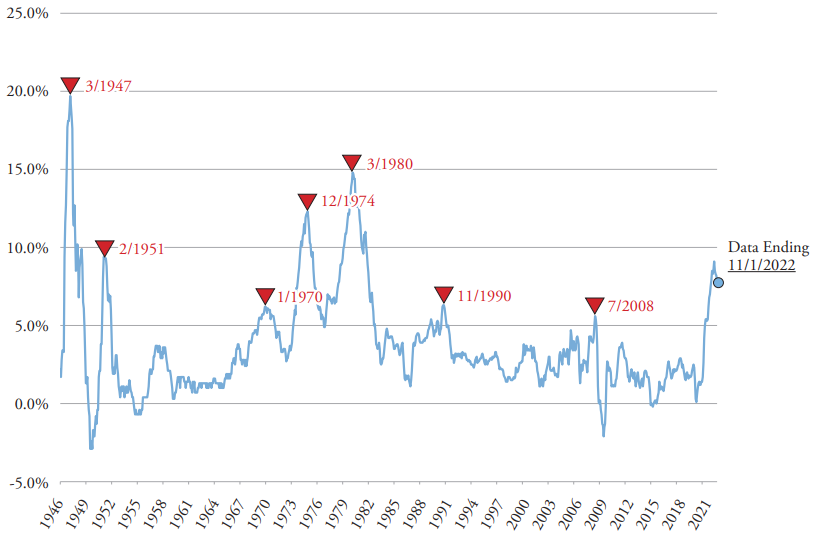
Sources: Renaissance Research, FactSet.
Past performance is not indicative of future results. Performance for periods of one year or less is not annualized. All returns are shown in U.S. dollars. Consumer Price Index (CPI) is a measure that examines the weighted average of prices of a basket of consumer goods and services, such as transportation, food, and medical care. It is calculated by taking price changes for each item.
Annualized inflation has dropped meaningfully from its 8.5% rate in March. While it may be premature to declare that inflation has passed its highest level, it is still worthwhile to review what has happened in the past to stocks when inflation peaked.
The chart above shows the annualized change in the CPI over the post-WWII era, with peaks in inflation noted (we only marked periods when inflation peaked at rates above 5%, similar to the current environment). The table below shows the price change of the S&P 500® Index over the 1, 3, and 5-year periods after a peak in inflation.
Stocks have generally performed well following a peak in inflation, averaging a 59.2% gain in price five years afterward. The only periods when stocks did not post gains were in periods that included severe recessions, such as in 2008 and 1973-1974.
Stock Market Performance After Peaks in Inflation, 1/1/1946–11/1/2022
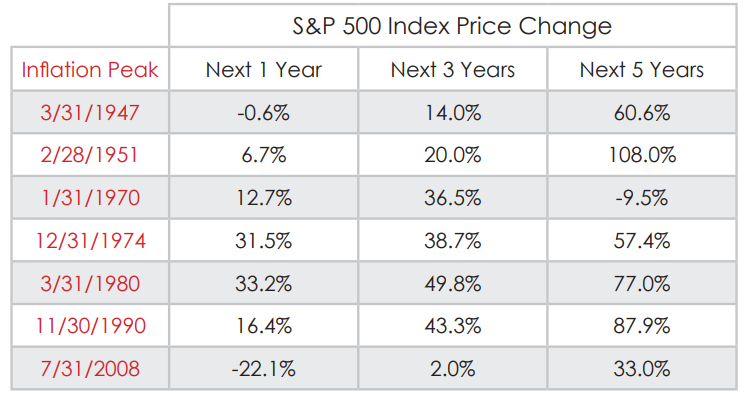
Sources: Bloomberg, FactSet.
The risk of a serious recession remains significant, as the Federal Reserve’s strategy of raising interest rates to choke off inflation may choke off economic growth as well. That said, if a serious recession is avoided partly because inflation peaked, historical precedent suggests that stocks are likely to do well in the future.
Past performance is not a guarantee of future results.
This Market Update reflects the thoughts of Renaissance as of November 15, 2022. This information has been provided by Renaissance Investment Management. All material presented is compiled from sources believed to be reliable and current, but accuracy cannot be guaranteed. This is not to be construed as an offer to buy or sell any financial instruments and should not be relied upon as the sole factor in an investment making decision, nor should it be considered a recommendation. The views and opinions expressed are those of the Chief Investment Officer at the time of publication and are subject to change. There is no guarantee that these views will come to pass. As with all investments, there are associated inherent risks. Please obtain and review all financial material carefully before investing.
PERFORMANCE
If Renaissance or benchmark performance is shown, it represents historically achieved results, and is no guarantee of future performance. Future investments may be made under materially different economic conditions, in different securities, and using different investment strategies and these differences may have a significant effect on the results portrayed. Each of these material market or economic conditions may or may not be repeated. Therefore, there may be sharp differences between the benchmark or Renaissance performance shown and the actual performance results achieved by any particular client. Benchmark results are shown for comparison purposes only. The benchmark presented represents unmanaged portfolios whose characteristics differ from the composite portfolios; however, they tend to represent the investment environment existing during the time periods shown. The benchmark cannot be invested in directly. The returns of the benchmark do not include any transaction costs, management fees, or other costs. The holdings of the client portfolios in our composites may differ significantly from the securities that comprise the benchmark shown. The benchmark has been selected to represent what Renaissance believes is an appropriate benchmark with which to compare the composite performance.
The value of an investment may fall as well as rise. Please note that different types of investments involve varying degrees of risk and there can be no assurance that any specific investment will either be suitable or profitable for a client or prospective client’s investment portfolio. Investor principal is not guaranteed and investors may not receive the full amount of their investment at the time of sale if asset values have fallen. No assurance can be given that an investor will not lose invested capital. Consultants supplied with these performance results are advised to use this data in accordance with SEC guidelines. The actual performance achieved by a client portfolio may be affected by a variety of factors, including the initial balance of the account, the timing and amount of any additions to or withdrawals from the portfolio, changes made to the account to reflect the specific investment needs or preferences of the client, durations and timing of participation as a RIM client, and a client portfolio’s risk tolerance, investment objectives, and investment time horizon. All investments carry a certain degree of risk, including the loss of principal, and are not guaranteed by the U.S. government.
REFERENCED INDEX
(Indices are unmanaged and are not available for direct investment.)
S&P 500 Index—The S&P 500 Stock Index is a market capitalization weighted index and consists of 500 stocks chosen for market size, liquidity, and industry group representation.
S&P Midcap 400 Index—The S&P MidCap 400 Index, is a capitalization-weighted index that serves as a gauge for the U.S. mid-cap equities sector.
S&P Small Cap 600 Index—The S&P Small Cap 600 Index is a capitalization-weighted index that measures the performance of selected U.S. stocks with a small market capitalization.
S&P DATA
S&P Dow Jones is the source and owner of the trademarks, service marks, and copyrights related to the S&P Indexes. S&P® is a trademark of S&P Dow Jones. This presentation may contain proprietary S&P data and unauthorized use, disclosure, copying, dissemination, or redistribution is strictly prohibited. This is a presentation of Renaissance Investment Management. S&P Dow Jones is not responsible for the formatting or configuration of this material or for any inaccuracy in Renaissance’s presentation thereof. This data is to be used for the recipient’s internal use only.